Team False Sharing
Contents
Analyzing False Sharing and Ways to Eliminate False Sharing
Team Members
Introduction
What is False Sharing (aka cache line ping-ponging)?
False Sharing is one of the sharing pattern that affect performance when multiple threads share data. It arises when at least two threads modify or use data that happens to be close enough in memory that they end up in the same cache line. False sharing occurs when they constantly update their respective data in a way that the cache line migrates back and forth between two threads' caches.
In this article, we will look at some examples that demonstrate false sharing, tools to analyze false sharing, and the two coding techniques we can implement to eliminate false sharing.
Cache Coherence
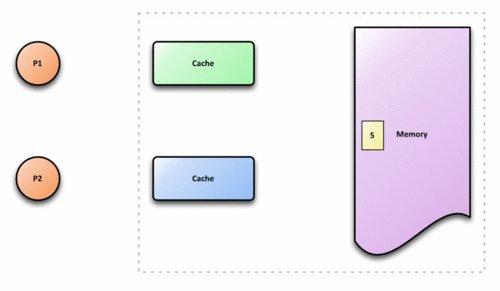
In Symmetric Multiprocessor (SMP)systems , each processor has a local cache. The local cache is a smaller, faster memory which stores copies of data from frequently used main memory locations. Cache lines are closer to the CPU than the main memory and are intended to make memory access more efficient. In a shared memory multiprocessor system with a separate cache memory for each processor, it is possible to have many copies of shared data: one copy in the main memory and one in the local cache of each processor that requested it. When one of the copies of data is changed, the other copies must reflect that change. Cache coherence is the discipline which ensures that the changes in the values of shared operands(data) are propagated throughout the system in a timely fashion. To ensure data consistency across multiple caches, multiprocessor-capable Intel® processors follow the MESI (Modified/Exclusive/Shared/Invalid) protocol. On first load of a cache line, the processor will mark the cache line as ‘Exclusive’ access. As long as the cache line is marked exclusive, subsequent loads are free to use the existing data in cache. If the processor sees the same cache line loaded by another processor on the bus, it marks the cache line with ‘Shared’ access. If the processor stores a cache line marked as ‘S’, the cache line is marked as ‘Modified’ and all other processors are sent an ‘Invalid’ cache line message. If the processor sees the same cache line which is now marked ‘M’ being accessed by another processor, the processor stores the cache line back to memory and marks its cache line as ‘Shared’. The other processor that is accessing the same cache line incurs a cache miss.
Identifying False Sharing
False sharing occurs when threads on different processors modify variables that reside on the same cache line. This invalidates the cache line and forces an update, which hurts performance.
False sharing is a well-know performance issue on SMP systems, where each processor has a local cache. it occurs when treads on different processors modify varibles that reside on th the same cache line like so.
The frequent coordination required between processors when cache lines are marked ‘Invalid’ requires cache lines to be written to memory and subsequently loaded. False sharing increases this coordination and can significantly degrade application performance.
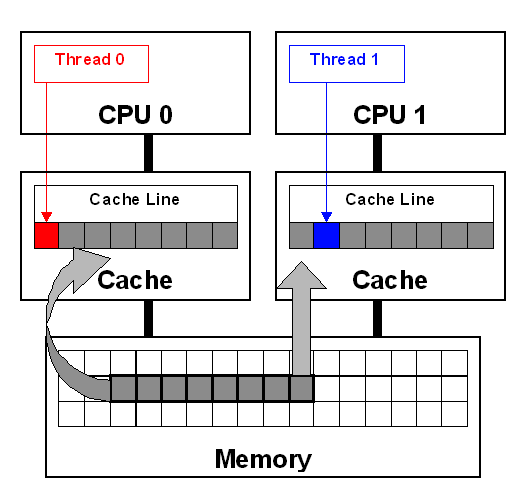
In Figure, threads 0 and 1 require variables that are adjacent in memory and reside on the same cache line. The cache line is loaded into the caches of CPU 0 and CPU 1. Even though the threads modify different variables, the cache line is invalidated forcing a memory update to maintain cache coherency.
#include <iostream>
#include <iomanip>
#include <cstdlib>
#include <chrono>
#include <algorithm>
#include <omp.h>
#define NUM_THREADS 8
#define  DIM 1000
using namespace std::chrono;

int main(int argc, char** argv) {
    int* matrix = new int[DIM*DIM];
    int odds = 0;
    // Initialize matrix to random Values
    srand(200);
    for (int i = 0; i < DIM; i++) {
         for(int j = 0; j < DIM; ++j){
             matrix[i*DIM + j] = rand()%50;
         }
    }
    int* odds_local = new int[NUM_THREADS];//odd numbers in matrix local to thread
    for(int i = 0; i < NUM_THREADS;i++){
        odds_local[i]=0;
    }
    int threads_used;
    int tid;
    omp_set_num_threads(NUM_THREADS);
   double start_time = omp_get_wtime();
#pragma omp parallel
{
    tid = omp_get_thread_num();
#pragma omp for
    for(int i=0; i < DIM; ++i){
        for(int j = 0; j < DIM; ++j){
            if(i==0 && j==0){threads_used = omp_get_num_threads();}
            if( matrix[i*DIM + j] % 2 != 0 )
                ++odds_local[tid];
        }
    }
#pragma omp critical
    odds += odds_local[tid];
}
    double time = omp_get_wtime() - start_time;
    std::cout<<"Execution Time: "<<time<<std::endl;
    std::cout<<"Threads Used: "<< threads_used<<std::endl;
    std::cout<<"Odds: "<<odds<<std::endl;
    return 0;
}
As you can see the execution time increase with the number of threads. These results are not what you would expect but there are 2 reasons that may have caused this. The first is that the overhead for creating and maintaining the threads is overwhelming larger than the contents of the for loop. The second is False sharing.
Eliminating False Sharing
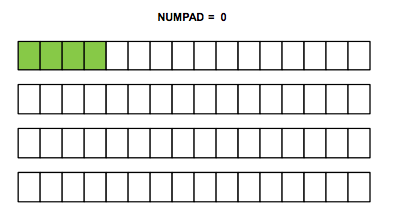
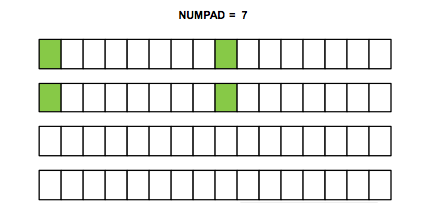
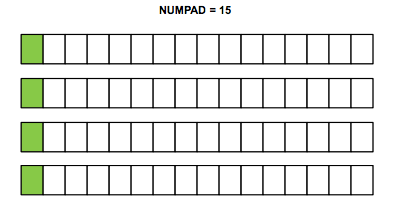
Padding
#include <iostream>
#include <omp.h>
#include "timer.h"
#define NUMPAD 7
#define NUM_THREADS 8
int main(int argc, const char * argv[]) {
    struct s{
        float value;
        int pad[NUMPAD];
    }Array[4];
    Timer stopwatch;
    int numThreadsUsed;
    const int SomeBigNumber = 100000000;
    omp_set_num_threads(NUM_THREADS);
    double start_time = omp_get_wtime();
#pragma omp parallel for
    for(int i = 0; i < 4;i++){
        if(i ==0){numThreadsUsed = omp_get_num_threads();}
        for(int j = 0;j < SomeBigNumber;j++){
            Array[i].value = Array[i].value + (float)rand();
        }
    }
    double time = omp_get_wtime() - start_time;
    std::cout<<time<<std::endl;
    std::cout<<"Threads Used: "<<numThreadsUsed<<std::endl;
    return 0;
}
Thread Local Variables
#include <iostream>
#include <iomanip>
#include <cstdlib>
#include <chrono>
#include <algorithm>
#include <omp.h>
#define NUM_THREADS 8
#define  DIM 1000
using namespace std::chrono;

int main(int argc, char** argv) {
    int* matrix = new int[DIM*DIM];
    int odds = 0;
    // Initialize matrix to random Values
    srand(200);
    for (int i = 0; i < DIM; i++) {
         for(int j = 0; j < DIM; ++j){
             matrix[i*DIM + j] = rand()%50;
         }
    }

    int threads_used;
    omp_set_num_threads(NUM_THREADS);
   double start_time = omp_get_wtime();
#pragma omp parallel
{
    int count_odds = 0.0;
#pragma omp for
    for(int i=0; i < DIM; ++i){
        for(int j = 0; j < DIM; ++j){
            if(i==0 && j==0){threads_used = omp_get_num_threads();}
            if( matrix[i*DIM + j] % 2 != 0 )
                ++count_odds;
        }
    }
#pragma omp critical
    odds += count_odds;
}
    double time = omp_get_wtime() - start_time;
    std::cout<<"Execution Time: "<<time<<std::endl;
    std::cout<<"Threads Used: "<< threads_used<<std::endl;
    std::cout<<"Odds: "<<odds<<std::endl;
    return 0;
}
Wasting memory to put your data on different cache lines is not ideal solution to the False Sharing problem even though it works. Using local variables, instead of contiguous array locations, the writes to memory will be spread out to different cache lines. Another benefit to this approach is that you do not have multiple threads writing to the same cache line, invalidating the data and bottlenecking the processes.
Intel VTune Amplifier
VTune Ampllifier is a trace based analysis tool used for deep analysis of a given program's runtime. Modern processors nowadays require much more than just optimizing single thread performance. High performing code must be:
- Threaded and scalable to utilize multiple CPUs
- Vectorized for efficient use of multiple FPUs
- Tuned to take advantage of non-uniform memory architectures and caches
Intel VTune Amplifier's single, user friendly analysis interface provides all these advanced profiling capabilities.
Some Key tools of VTune Amplifier
- HotSpot Analysis: Hotspot analysis quickly identifies the lines of code/functions that are taking up a lot of CPU time.
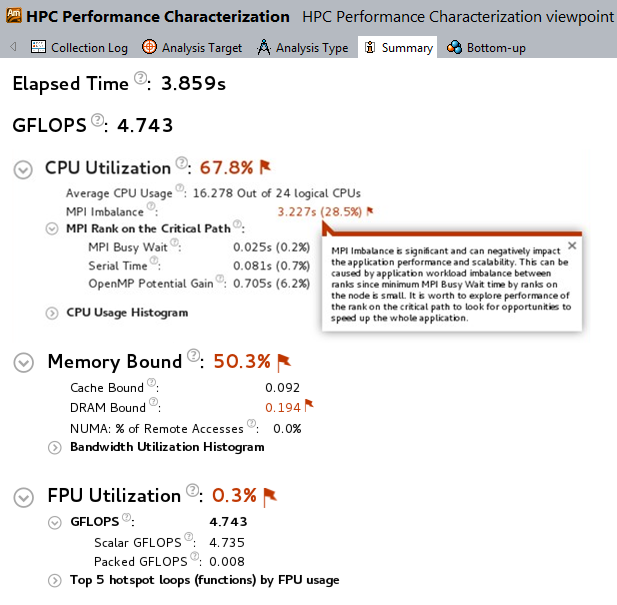
- High-performance computing (HPC) Analysis: HPC analysis gives a fast overview of three critical metrics;
- CPU utilizations (for both thread and MPI parallelism)
- Memory access
- FPU utilization(FLOPS)
- Locks and Waits: VTune Amplifier makes it easy to understand multithreading concepts since it has a built-in understanding of parallel programming. Locks and waits analysis allows you to quickly find he common causes of slow threaded code.
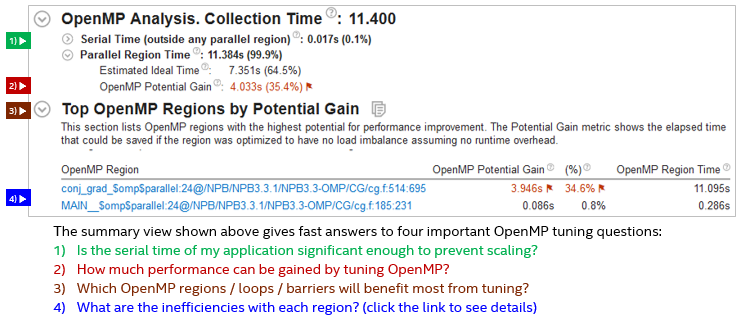
- Easier, More Effective OpenMP* and MPI multirank Tuning":
- The summary report quickly gets you top four answers you need to effectively improve openMP* performance.
- VTune Amplifier provides hardware-based profiling to help analyze your code's efficient use of the microprocessor
This is just a brief summary of some of the tools available within VTune Amplifier. For more details, please visit Intel VTune Amplifier website.
