Team1/Debugging your programs
12. Debugging Your Program
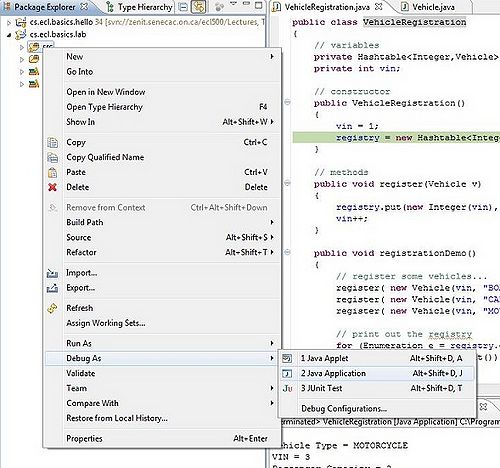
12.1. Debugging and Debugger Perspective: In order to debug your application, select the Source folder (src), right click and select "Debug As" and choose Java Application from the menu. You will receive a pop-up message indication shifting the perspective to Debug perspective which has all the view used in debugging for convenience.Answer "Yes" to the pop-up.
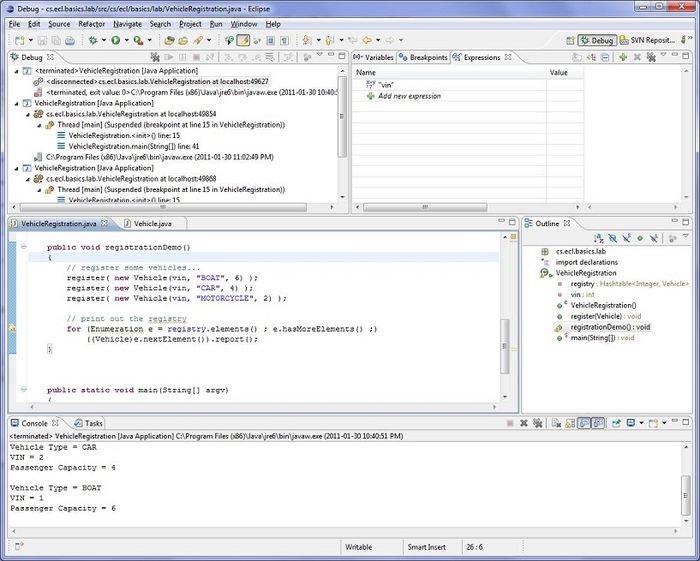
12.2. Setting Break Points: Double Click on the gray bay at the left side of the code to set a break point at any line.
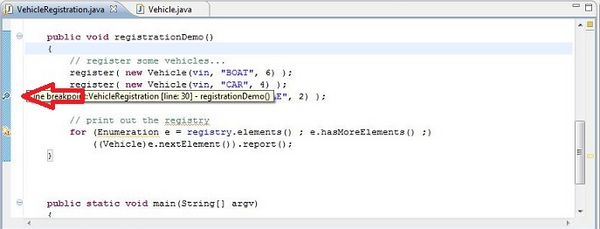
12.3. Stop and Start Debugging: Click on the debug button on the top bar to start debugging.The program will run in debug mode and stops at your break point.


You can stop or resume debugging using stop or resume buttons in debug view.

12.4. Step Over:To move forward in the code and step over method calls, press F6 or use the Step Over button in the Debug view.

12.5. Step Into:To move forward in the program and step into method press F5 or use Step Into button in the Debug view.

12.6. Other Useful Function keys: Normal 0 false false false EN-US X-NONE AR-SA
F7: will go to the caller of the method/ function. So this will leave the current code and go to the calling code.
F8: goes to the next break point. If no further break point is encountered then the program will normally run.
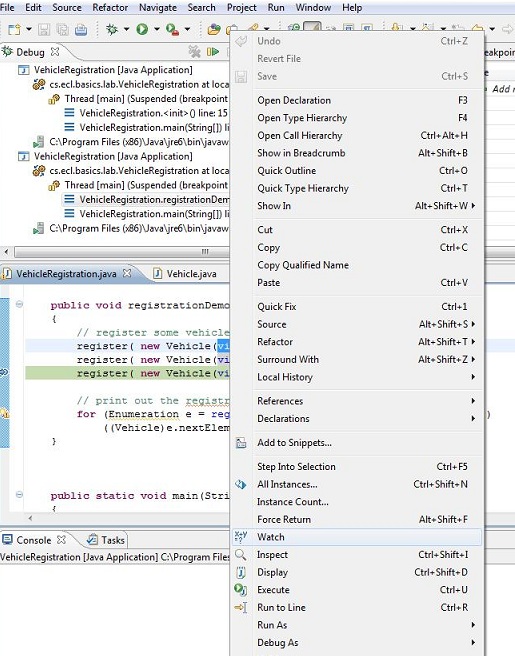
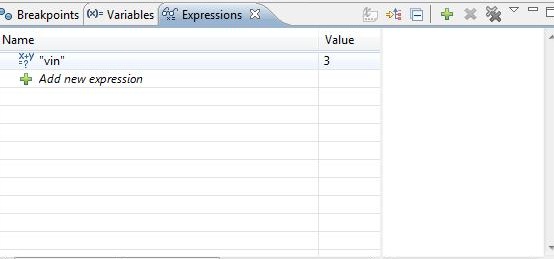
12.7. Add Watch:To see the value of a variable or an statement, you need to add watch to it. Select the variable, right click and select "Watch" from the menu. The variable will be added as Expression in Expression view and the value of it is shown in any step of the debugger.
