Difference between revisions of "GPU621/Pragmatic"
(→Corrected correction mistake) |
(→Updated Debug Threads and Processes section of the notes with images and information on how to access each window) |
||
| Line 42: | Line 42: | ||
Following are the tools for debugging Threads and Processes in Visual Studio: | Following are the tools for debugging Threads and Processes in Visual Studio: | ||
| − | + | 1. Attach to Process (Dialog box) - Allows to attach the Visual Studio debugger to a process that is already running (Select on DEBUG > Attach to Process or press Ctrl + Alt + P); | |
| − | + | ||
| − | + | [[File:Attach to Process Window.png|800px]] | |
| − | + | ||
| − | + | 2. Process (Window) - Shows all processes that are currently attached to the Visual Studio debugger (While debugging select DEBUG > Windows > Processes or press Ctrl + Alt + Z); | |
| − | + | ||
| − | + | [[File:Processes Window.png|800px]] | |
| − | + | ||
| + | 3. Threads (Window) - Allows to view and manipulate threads (While debugging select DEBUG > Windows > Threads or press Ctrl + Alt + H); | ||
| + | |||
| + | [[File:Threads Window.png|800px]] | ||
| + | |||
| + | 4. Parallel Stacks (Window) - Shows call stack information for all the threads in the application (While debugging select DEBUG > Windows > Parallel Stacks or press Ctrl + Shift + D, S); | ||
| + | |||
| + | [[File:Parallel Stacks Window.png|800px]] | ||
| + | |||
| + | 5. Parallel Tasks (Window) - Displays all parallel tasks that are currently running as well as tasks that are scheduled for execution (While debugging select DEBUG > Windows > Parallel Tasks or press Ctrl + Shift + D, K); | ||
| + | |||
| + | [[File:Parallel Tasks Window.png|800px]] | ||
| + | |||
| + | 6. Parallel Watch (Window) - Allows to see and manipulate the values for one expression executed on multiple threads (While debugging select DEBUG > Windows > Parallel Watch > Parallel Watch 1/2/3/4 or press Ctrl + Shift + D, 1/2/3/4); | ||
| + | |||
| + | [[File:Parallel Watch Window.png|800px]] | ||
| + | |||
| + | 7. GPU Threads (Window) - Allows to examine and work with threads that are running on the GPU in the application that is being debugged (While debugging select DEBUG > Windows > GPU Threads); | ||
| + | |||
| + | [[File:GPU Threads Window.png|800px]] | ||
| + | |||
| + | 9. Debug Location (Toolbar) - Allows to manipulate processes and threads while debugging the application (Select on VIEW > Toolbars > Debug Location); | ||
| + | |||
| + | [[File:Debug Location Toolbar.png|800px]] | ||
Above mentioned tools can be classified as follows: | Above mentioned tools can be classified as follows: | ||
Revision as of 18:44, 7 November 2016
Pragmatic
Group Members
- Vadym Karpenko, Research, and everything else.
- Oleksandr Zhurbenko, Research, and everything else.
Progress
Entry on: October 17th 2016
Group page (Pragmatic) has been created and 3 suggested project topics are being considered (Preference in order specified):
- OpenMP Debugging in Visual Studio - [MSDN Notes]
- Analyzing False Sharing - [Herb Sutter's Article]
- Debugging Threads in Intel Parallel Studio - [Dr Dobbs Article]
Once project topic is confirmed (On Thursday, October 20th 2016, by Professor Chris Szalwinski), group will be able to proceed with topic research.
Entry on: November 1st 2016
Project topic has been confirmed (OpenMP Debugging in Visual Studio - [MSDN Notes]) and team is working on researching material and testing newly acquired knowledge.
Team is considering using Prefix Scan or Convolution workshops for demonstration purposes.
Notes
- All notes are based on the material outlined in "Debug Multithreaded Applications in Visual Studio" section of MSDN documentation at: https://msdn.microsoft.com/en-us/library/ms164746.aspx and other related MSDN documentation.
Entry on: November 6th 2016
Debug Multithreaded Applications in Visual Studio
While parallel processing of multiple threads increases program performance, it makes debugging task harder, since we need to track multiple threads instead of just one (Master thread). Also some potential bugs are introduced with parallel processing, for example, when race condition (When multiple processes or threads try to access same resource at the same time, for more information visit Race Condition Wiki) occurs and mutual exclusion is performed incorrectly, it may create a deadlock condition (When all threads wait for the resource and none can execute, for more info visit Deadlock Wiki), which can be very difficult to debug.
Visual Studio provides many useful tools that make multithreaded debugging tasks easier.
Debug Threads and Processes
A process is a task or a program that is executed by operating system, while a thread is a set of instructions to be executed within a process. A process may consist of one or more threads.
Following are the tools for debugging Threads and Processes in Visual Studio:
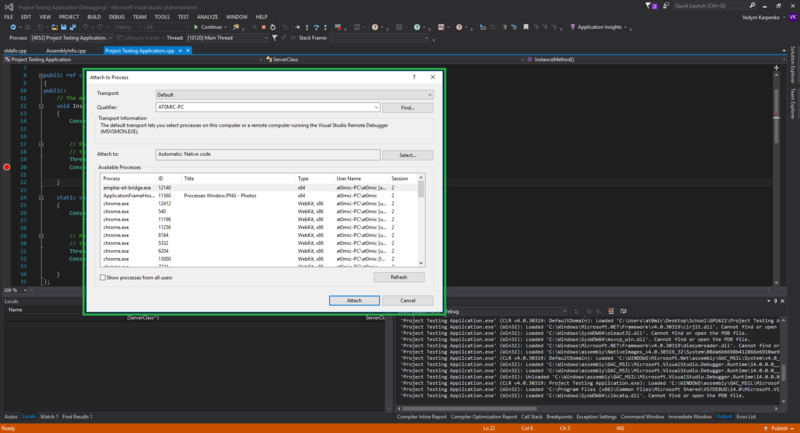
1. Attach to Process (Dialog box) - Allows to attach the Visual Studio debugger to a process that is already running (Select on DEBUG > Attach to Process or press Ctrl + Alt + P);
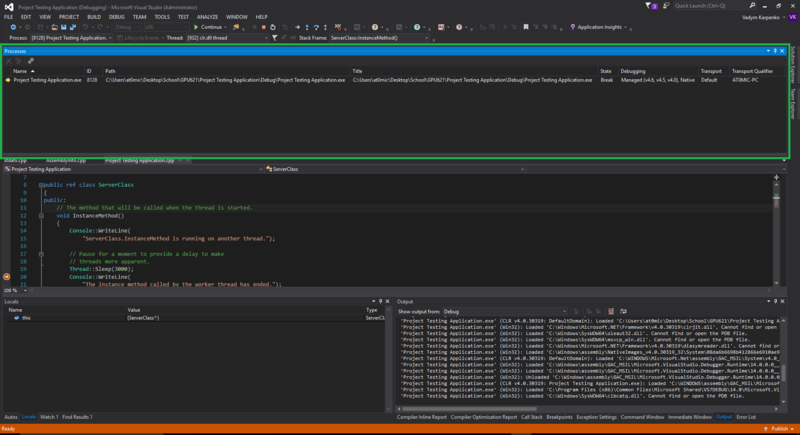
2. Process (Window) - Shows all processes that are currently attached to the Visual Studio debugger (While debugging select DEBUG > Windows > Processes or press Ctrl + Alt + Z);
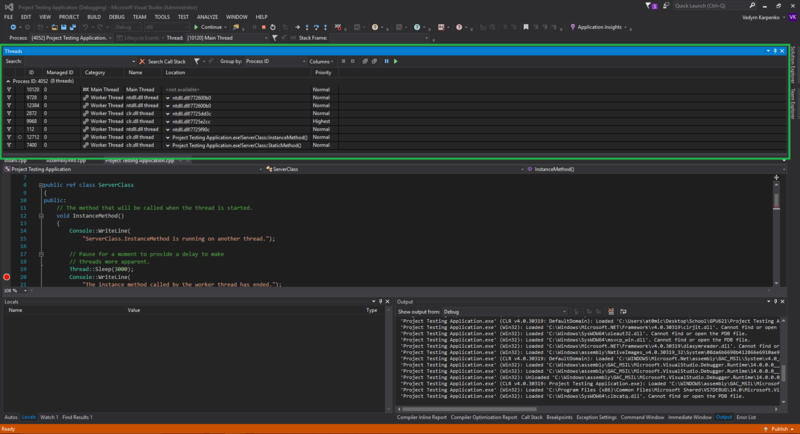
3. Threads (Window) - Allows to view and manipulate threads (While debugging select DEBUG > Windows > Threads or press Ctrl + Alt + H);
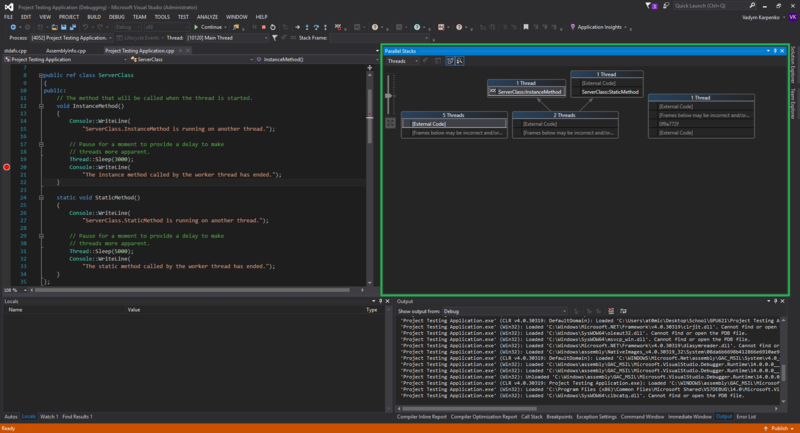
4. Parallel Stacks (Window) - Shows call stack information for all the threads in the application (While debugging select DEBUG > Windows > Parallel Stacks or press Ctrl + Shift + D, S);
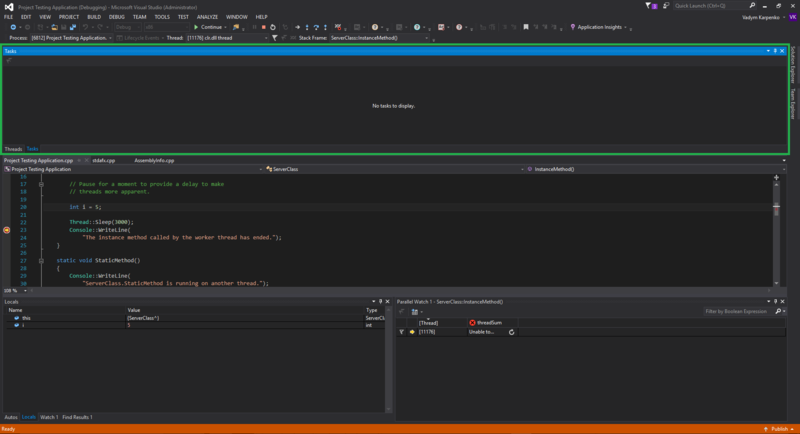
5. Parallel Tasks (Window) - Displays all parallel tasks that are currently running as well as tasks that are scheduled for execution (While debugging select DEBUG > Windows > Parallel Tasks or press Ctrl + Shift + D, K);
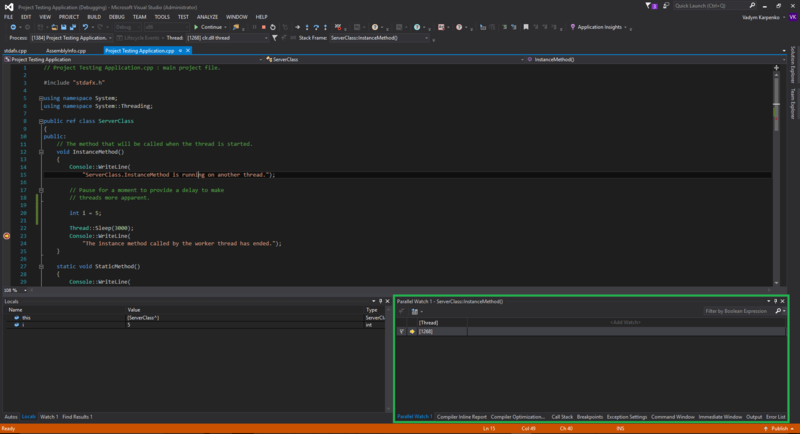
6. Parallel Watch (Window) - Allows to see and manipulate the values for one expression executed on multiple threads (While debugging select DEBUG > Windows > Parallel Watch > Parallel Watch 1/2/3/4 or press Ctrl + Shift + D, 1/2/3/4);
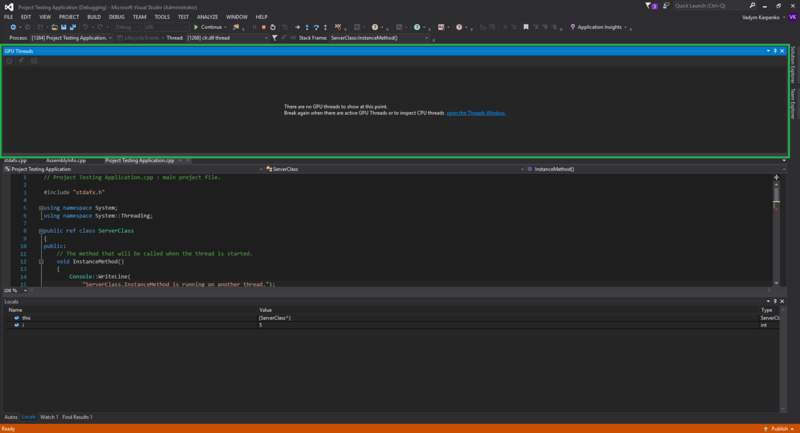
7. GPU Threads (Window) - Allows to examine and work with threads that are running on the GPU in the application that is being debugged (While debugging select DEBUG > Windows > GPU Threads);
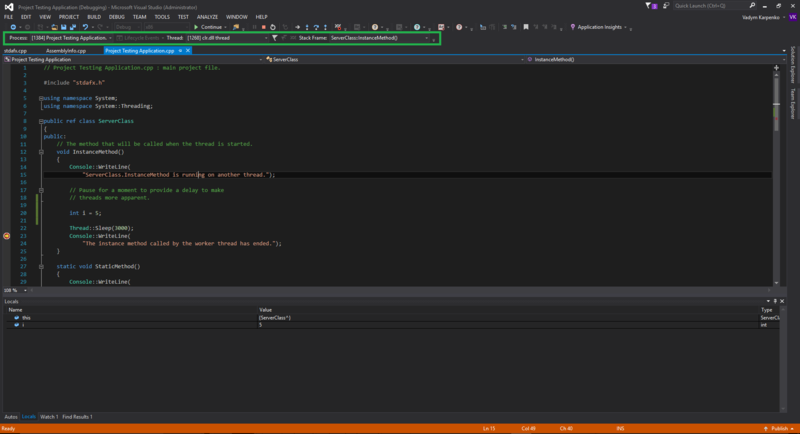
9. Debug Location (Toolbar) - Allows to manipulate processes and threads while debugging the application (Select on VIEW > Toolbars > Debug Location);
Above mentioned tools can be classified as follows:
- The primary tools for working with processes are the Attach To Process dialog box, the Processes window, and the Debug Location toolbar;
- The primary tools for working with threads are the Threads window and the Debug Location toolbar.
- The primary tools for working with multithreaded applications are the Parallel Stacks, Parallel Tasks, Parallel Watch, and GPU Threads windows.
