GPU621/Intel Inspector
GPU621/DPS921 | Participants | Groups and Projects | Resources | Glossary
Contents
Intel Parallel Studio Inspector
Project Overview
Intel Inspector is a dynamic memory and threading error debugger which able to detect and locate memory leaks, deadlocks, and race conditions. The purpose of this project is to introduce Intel Inspector and demonstrate how to use Inspector to debug our code.
Group Members
Features
The purpose of the Intel inspector is to help us find difficult and non-deterministic errors in large programs. As the program gets bigger and has complicated logic it is difficult to find memory leaks and threading errors. Some of it's main features are
- Locate Nondeterministic Threading Errors
Threading errors are usually nondeterministic and difficult to reproduce. Intel Inspector helps detect and locate them, including data race conditions (heap and stack races), deadlocks, lock hierarchy violations, and then cross-thread stack access errors.
- Detect Hard-to-Find Memory Errors
Memory errors can be difficult to find, such as memory leaks, corruption, mismatched allocation and deallocation API, inconsistent use of memory API, illegal memory access, and uninitialized memory read. Intel Inspector finds these errors and integrates with a debugger to identify the associated issues. It also diagnoses memory growth and locates the call stack causing it.
- Simplify the Diagnosis of Difficult Errors
Debugger breakpoints diagnose errors by breaking into the debugger just before the error occurs. When debugging outside of Intel Inspector, a breakpoint stops execution at the right location. The problem with this is that the location might be executed thousands of times before the error occurs. By combining debug with analysis, Intel Inspector determines when a problem occurs and breaks into the debugger at the right time and location.
- Find Persistence Memory Errors
Intel® Optane™ DC persistent memory is a new memory technology with high-capacity persistent memory for the data center. It maintains data even when the power is shut off, but this data must first be properly flushed out of volatile cache memory. Persistence Inspector helps find possible persistent memory errors so that the system operates correctly when the power is restored.
It detects:
Missing or redundant cache flushes Missing store fences Out-of-order persistent memory stores Incorrect undo logging for the
Software supported
Intel Inspector supports various languages (C, C++, and Fortran), operating systems (Windows and Linux), IDEs (Visual Studio, Eclipse, etc.), and compilers (Intel C++, Intel Fortran, Visual C++, GCC, etc.). It also supports OpenMP, TBB, Parallel language extensions for the Intel C++ Compiler, Microsoft PPL, Win32 and POSIX threads, Intel MPI Library.
Tutorial
Intel Inspector GUI
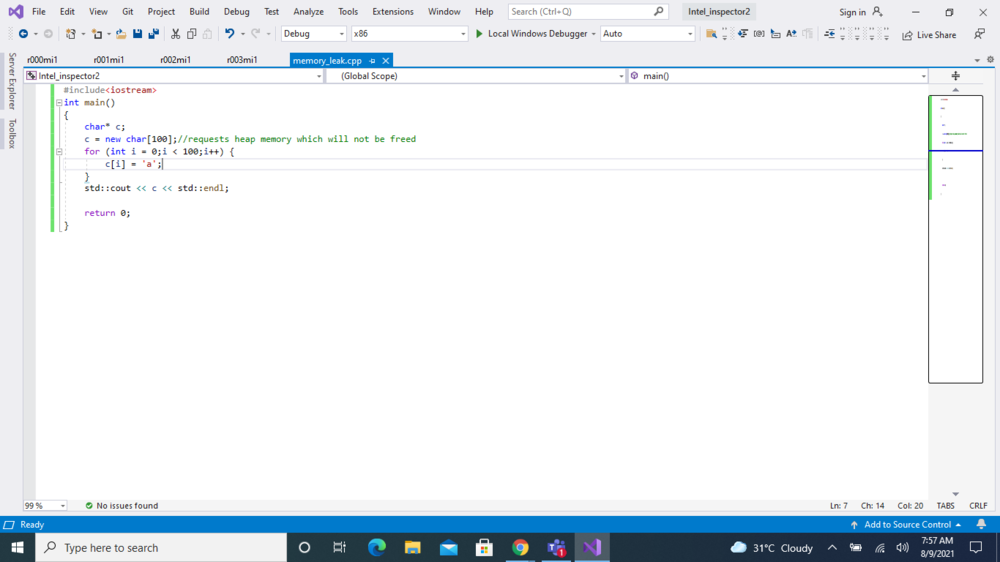
We will analyze a simple code with memory leak to demonstrate the steps to use Intel Inspector's Analysis
Step 1: Write your code which is to be analyzed and build the project
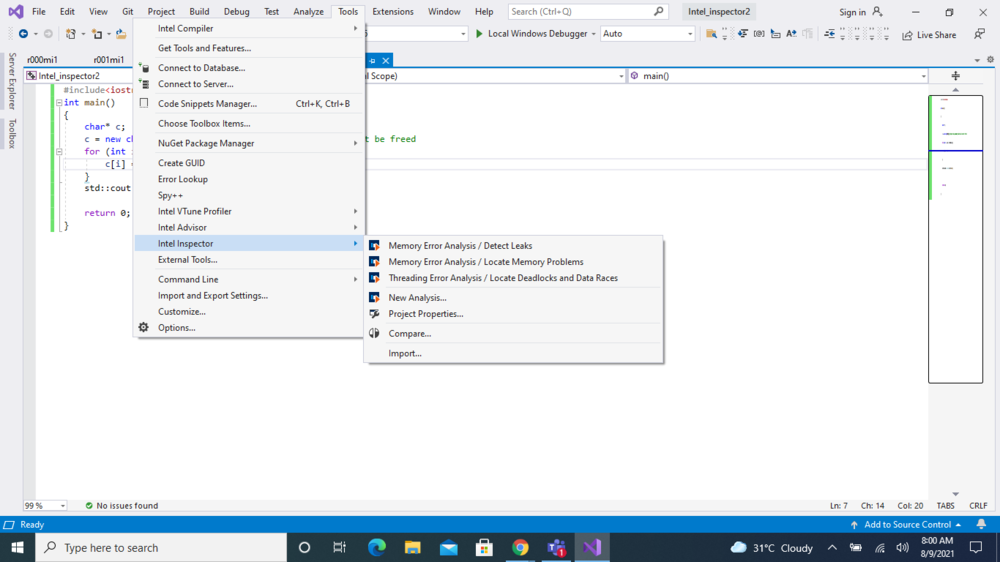
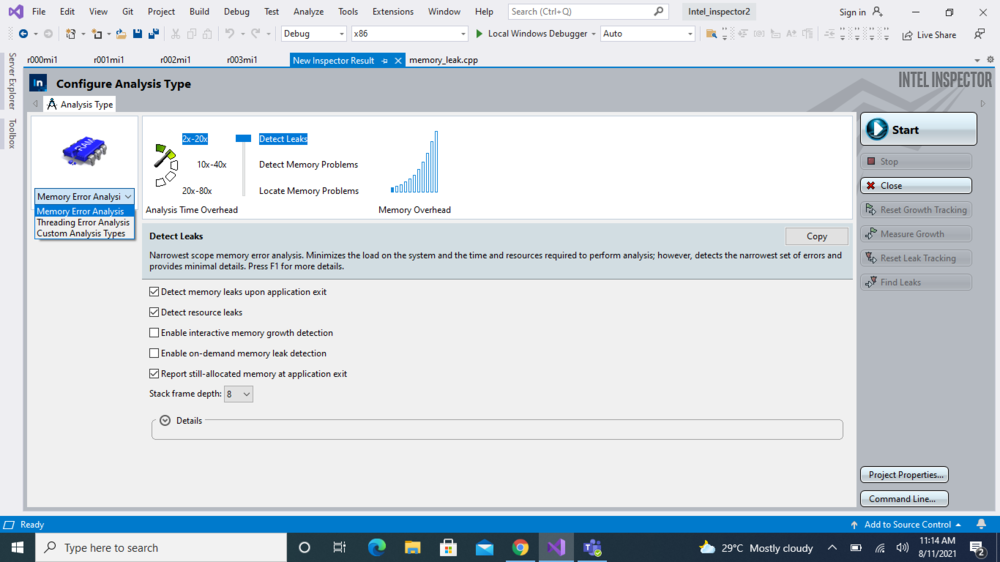
Step 2: Go to tools > Intel Inspector > Memory Error Analysis (there are several other options which can be used as per requirements)
Analysis Panel Details
On-demand Memory Analysis
Intel Inspector customarily displays memory leaks at the end of an analysis run when an application exits; however, you can also use the Intel Inspector on-demand memory leak detection feature to gather memory leak information while an application is running. This is useful if:
- An application does not terminate (such as a server process).
- You want memory leak information, but you do not want to wait for an application to terminate.
- You want to determine if memory is leaked during a specific interval of application execution, or during a specific user action.
Memory Leak
int main()
{
	int* myInts = new int[5] ;

	// incorrectly deallocating an array of pointer
	delete myInts ;

	return 0 ;
}
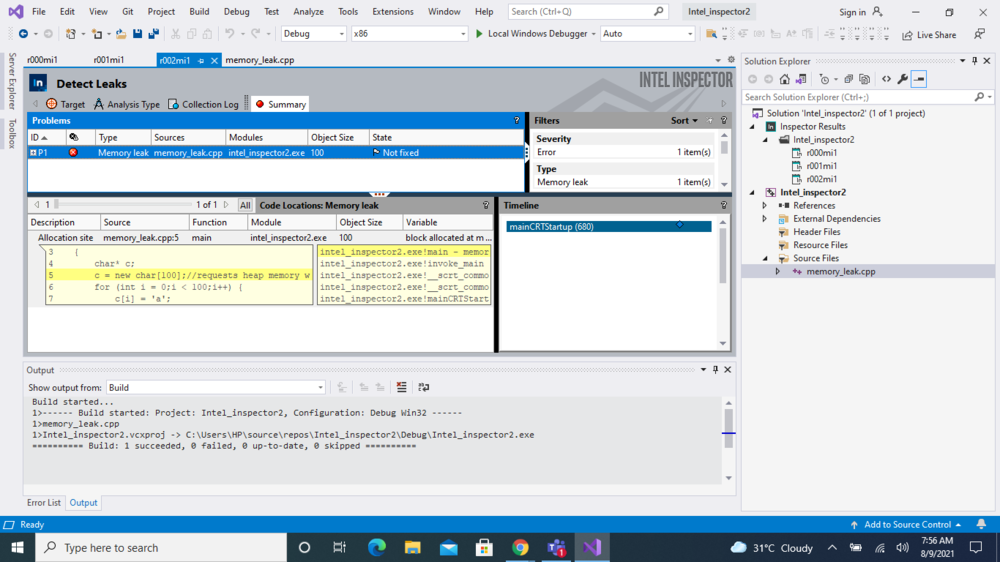
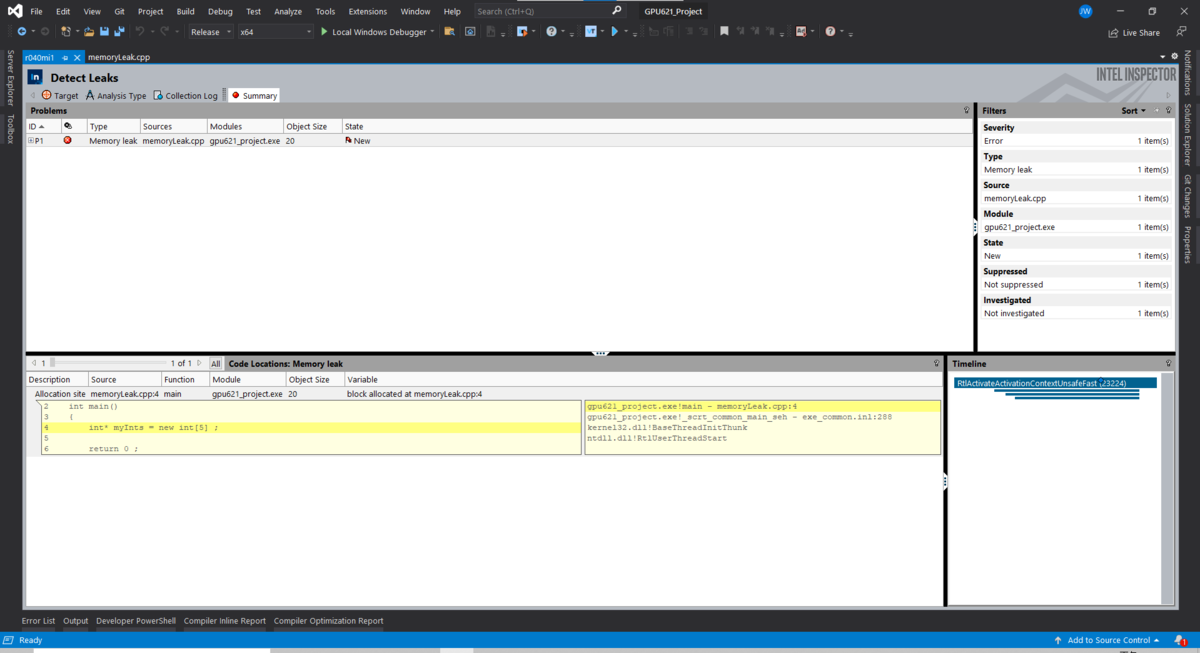
The result shows there is memory allocation on line 5 and it is causing memory leak.
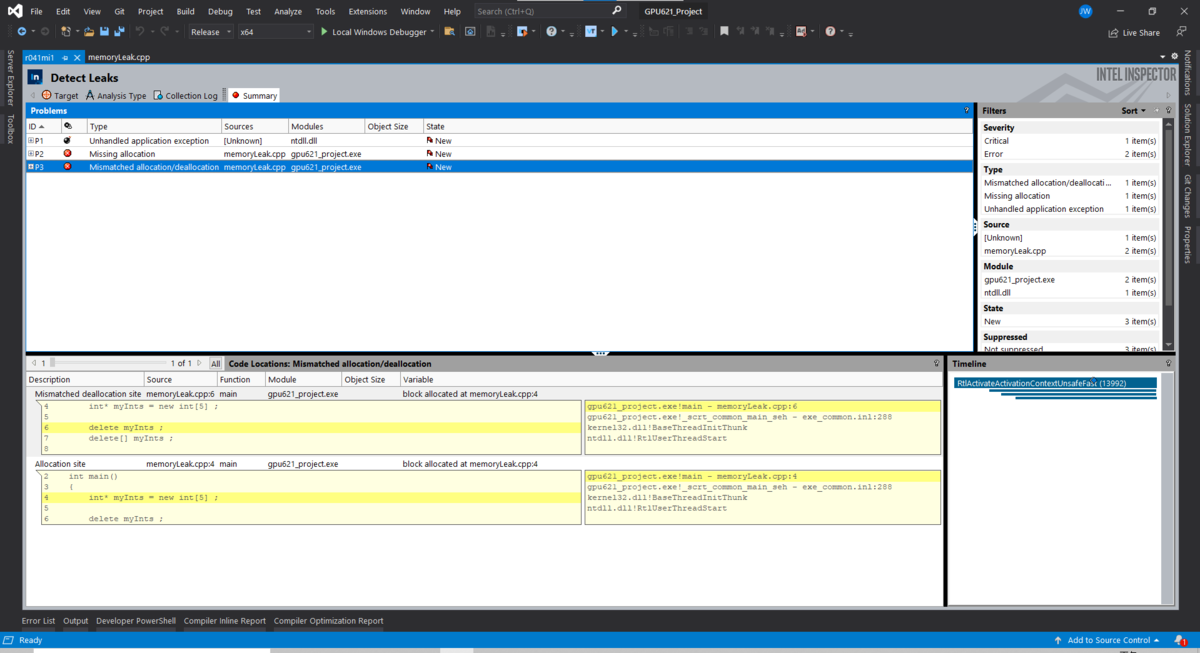
If there is type mismatched deallocation, Inspector will mark down the allocation and deallocation line.
In this case, the correct way to deallocate an array of pointer is delete[] myInts.
