Difference between revisions of "GPU621/Intel Inspector"
| Line 20: | Line 20: | ||
Intel Inspector supports various languages (C, C++, and Fortran), operating systems (Windows and Linux), IDEs (Visual Studio, Eclipse, etc.), and compilers (Intel C++, Intel Fortran, Visual C++, GCC, etc.). It also supports OpenMP, TBB, Parallel language extensions for the Intel C++ Compiler, Microsoft PPL, Win32 and POSIX threads, Intel MPI Library. | Intel Inspector supports various languages (C, C++, and Fortran), operating systems (Windows and Linux), IDEs (Visual Studio, Eclipse, etc.), and compilers (Intel C++, Intel Fortran, Visual C++, GCC, etc.). It also supports OpenMP, TBB, Parallel language extensions for the Intel C++ Compiler, Microsoft PPL, Win32 and POSIX threads, Intel MPI Library. | ||
| + | |||
| + | =Tutorial= | ||
| + | |||
| + | ==Intel Inspector GUI== | ||
| + | |||
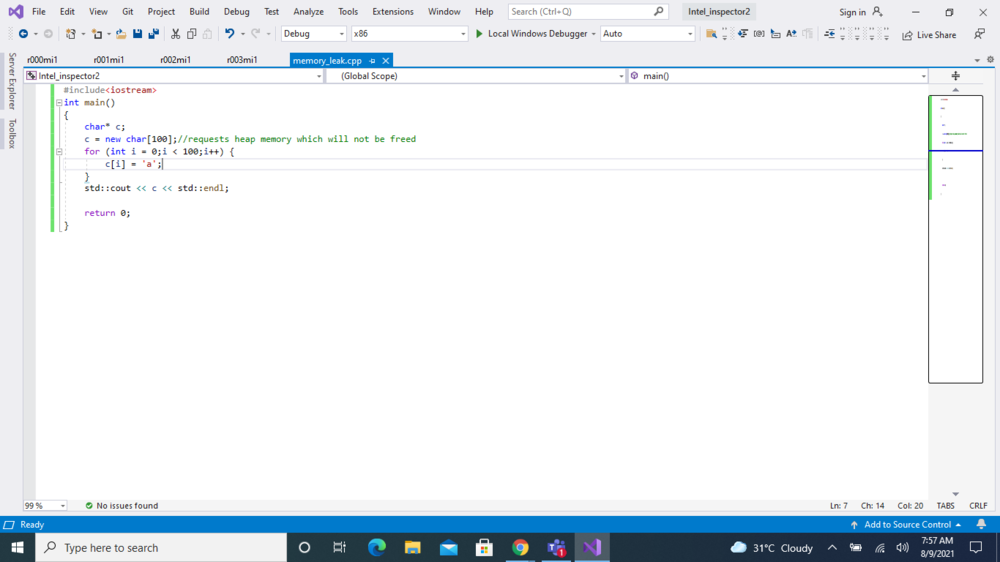
| + | We will analyze a simple code with memory leak to demonstrate the steps to use Intel Inspector's Analysis | ||
| + | |||
| + | Step 1: Write your code which is to be analyzed and build the project | ||
| + | |||
| + | [[File:Step1 intelInspector.png|1000px|alt text]] | ||
| + | |||
| + | |||
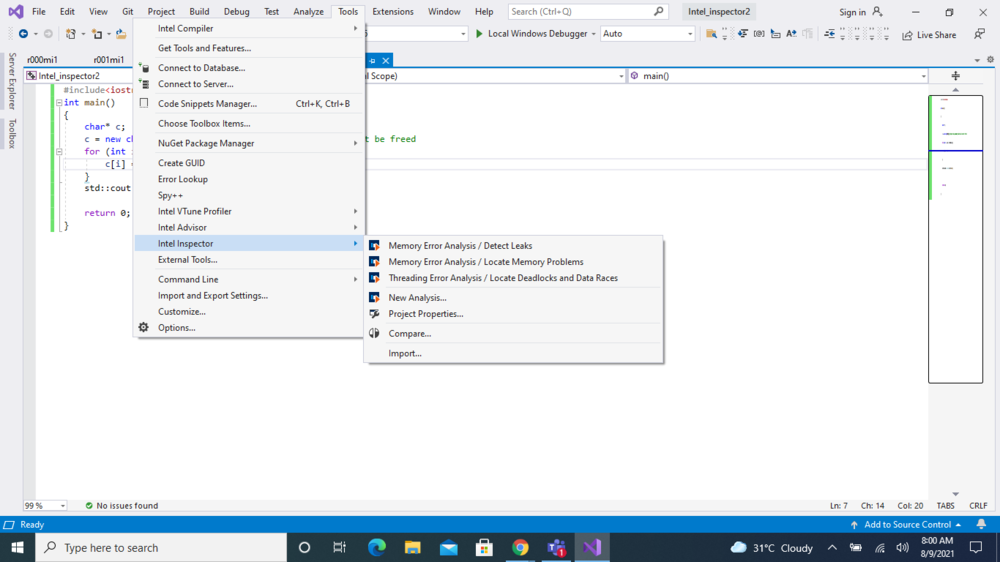
| + | Step 2: Go to tools > Intel Inspector > Memory Error Analysis (there are several other options which can be used as per requirements) | ||
| + | |||
| + | [[File:Step2 IntelInspector.png|1000px|alt text]] | ||
| + | |||
= Memory Leak = | = Memory Leak = | ||
= References = | = References = | ||
Revision as of 06:38, 10 August 2021
GPU621/DPS921 | Participants | Groups and Projects | Resources | Glossary
Contents
Intel Parallel Studio Inspector
Project Overview
Intel Inspector is a dynamic memory and threading error debugger which able to detect and locate memory leaks, deadlocks, and race conditions. The purpose of this project is to introduce Intel Inspector and demonstrate how to use Inspector to debug our code.
Group Members
Features
The purpose of the Intel inspector is to help us find difficult and non-deterministic errors in large programs. As the program gets bigger and has complicated logic it is difficult to find memory leaks and threading errors. Some of it's main features are
- Locate Nondeterministic Threading Errors
- Detect Hard-to-Find Memory Errors
- Simplify the Diagnosis of Difficult Errors
- Find Persistence Memory Errors
Software supported
Intel Inspector supports various languages (C, C++, and Fortran), operating systems (Windows and Linux), IDEs (Visual Studio, Eclipse, etc.), and compilers (Intel C++, Intel Fortran, Visual C++, GCC, etc.). It also supports OpenMP, TBB, Parallel language extensions for the Intel C++ Compiler, Microsoft PPL, Win32 and POSIX threads, Intel MPI Library.
Tutorial
Intel Inspector GUI
We will analyze a simple code with memory leak to demonstrate the steps to use Intel Inspector's Analysis
Step 1: Write your code which is to be analyzed and build the project
Step 2: Go to tools > Intel Inspector > Memory Error Analysis (there are several other options which can be used as per requirements)

