DPS921/Intel Parallel Studio Inspector
Contents
Project Description
The scope of the project is to do determine how useful Intel Inspector is and how to use the debugging feature. The topics we are going to cover today is; what is Intel Parallel Studio Inspector, what are the pros and cons, and how to use Intel Parallel Studio Inspector. The goal of this is to educate ourselves and our classmate the importance of Intel Parallel Studio Inspector and how to use it.
What is Intel Parallel Studio Inspector
Intel Inspector is an easy-to-use memory and threading error debugger for C, C++, and Fortran applications that run on windows and Linux. It helps find and fix problems- such as memory leaks and deadlocks-before they hinder productivity and time-to-market. Inspector is a correctness checking program that helps you find and fix problem like memory leaks and deadlocks. There are two distinct side of the inspector coin design to target specific type of problem: threading error and memory error. Inspector is a correctness checking program that helps you find and fix problem like memory leaks and deadlocks. There are two distinct side of the inspector coin design to target specific type of problem: threading error and memory error.
Reliability: find deadlocks and memory errors that cause lockups & crashes
Security: Find memory and threading vulnerabilities used by hackers
Accuracy: Identify memory corruption and race conditions to eliminate erroneous results
Different Deadlocks level
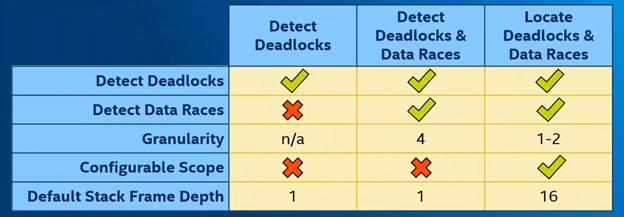
The threading and memory focus each level of analysis. Which progressive gets more details in cost of higher overhead. Each level are level 1: detects deadlock, level 2: detect deadlocks & data races, and level 3: locate deadlocks & data races.
Detect Deadlocks: when two or more threads are permanently stuck because no thread will give up its current lock until it can take the next one. But that lock is being held by another thread in the same position.
Detect deadlocks & data races: will do exactly what I explained earlier plus detect data races. Data races is when the outcome of an operation can change depending on what order the thread reached in.
Locate deadlocks & data races: is more detail with a smaller granularity deeper default stack frame depth and configurable scope.
Different Memory level
The three levels for memory error analysis are detect leaks, detect memory problems and locate memory problems.
Detect Leaks: just tracks whether the memory allocating gets deallocated. Detect Memory Problems: Expands on detect leaks by also detecting bad interaction of memory such as invalid memory access, as well as enabling real time analysis. Locate Memory Problems: Is similar to detect memory problems but more detailed. With a deeper default stack frame depth and guard zones which shows offsets of memory accesses of allocated blocks. In the inspector the button “Reset Leak Tracking”, stops tracking all currently allocated memory for leaks, discarding associated tracking data without reporting it. The button “Find Leaks” creates a report on the leak status of all currently allocated memory, then stops tracking those blocks. The button “Reset Growth Tracking” discards all currently-tracked memory growth data. Memory currently allocated won’t count towards growth. The button “Measure Growth” creates a report on how much memory usage has grown since the last reset. Does not reset tracking information.
Pros vs Cons
TBD
Sample Code for Intel Inspector
TBD
How to use Intel Parallel Studio Inspector
TBD
Group Members
Reference
Progress
Update 1: Sunday November 8th 2020 - Created basic topic to research for Intel Parallel Studio Inspector

