Difference between revisions of "DPS921/Intel Parallel Studio Inspector"
(→What is Intel Parallel Studio Inspector) |
(→What is Intel Parallel Studio Inspector) |
||
| Line 16: | Line 16: | ||
<b>Accuracy:</b> Identify memory corruption and race conditions to eliminate erroneous results | <b>Accuracy:</b> Identify memory corruption and race conditions to eliminate erroneous results | ||
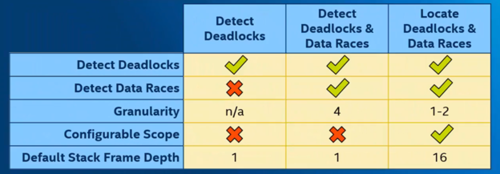
| − | [[File: | + | The threading and memory focus each level of analysis. Which progressive gets more details in cost of higher overhead. Each level are level 1: detects deadlock, level 2: detect deadlocks & data races, and level 3: locate deadlocks & data races. |
| + | |||
| + | [[File:DeadlockLevels.png|500px]] | ||
== Pros vs Cons == | == Pros vs Cons == | ||
Revision as of 01:06, 29 November 2020
Contents
Project Description
The scope of the project is to do determine how useful Intel Inspector is and how to use the debugging feature. The topics we are going to cover today is; what is Intel Parallel Studio Inspector, what are the pros and cons, and how to use Intel Parallel Studio Inspector. The goal of this is to educate ourselves and our classmate the importance of Intel Parallel Studio Inspector and how to use it.
What is Intel Parallel Studio Inspector
Intel Inspector is an easy-to-use memory and threading error debugger for C, C++, and Fortran applications that run on windows and Linux. It helps find and fix problems- such as memory leaks and deadlocks-before they hinder productivity and time-to-market. Inspector is a correctness checking program that helps you find and fix problem like memory leaks and deadlocks. There are two distinct side of the inspector coin design to target specific type of problem: threading error and memory error. Inspector is a correctness checking program that helps you find and fix problem like memory leaks and deadlocks. There are two distinct side of the inspector coin design to target specific type of problem: threading error and memory error.
Reliability: find deadlocks and memory errors that cause lockups & crashes
Security: Find memory and threading vulnerabilities used by hackers
Accuracy: Identify memory corruption and race conditions to eliminate erroneous results
The threading and memory focus each level of analysis. Which progressive gets more details in cost of higher overhead. Each level are level 1: detects deadlock, level 2: detect deadlocks & data races, and level 3: locate deadlocks & data races.
Pros vs Cons
TBD
Sample Code for Intel Inspector
TBD
How to use Intel Parallel Studio Inspector
TBD
Group Members
Reference
Progress
Update 1: Sunday November 8th 2020 - Created basic topic to research for Intel Parallel Studio Inspector
