GPU621/Intel Parallel Studio Inspector.
Contents
Group Members
Project Overview
This project was created to provide detailed documentation on Intel Parallel Studio Inspector, how it works, and demonstrate key features that will help reduce write parallel
Intel Parallel Studio Inspector
Intel Parallel Studio Inspector is a dynamic tool that helps users detect memory and threading errors in their serial and multithreaded applications. Intel Inspector is available on Windows and Linux operating systems and works with C, C++, C#, and Fortran programming languages. For this project, we will be using Visual Studio 2019 with Inspector.
Visit this site for more information on how to install Intel Inspector: https://www.intel.com/content/www/us/en/developer/tools/oneapi/inspector.html#gs.i68l9p
How to use Intel Inspector
Finding Memory Issues
Proper memory management is a common issue within programs, and it can be especially difficult to track. Intel Inspector can locate different memory issues such as memory leaks, memory corruption, allocation / de-allocation API mismatches, inconsistent memory API usage, illegal memory access, and uninitialized memory reads.
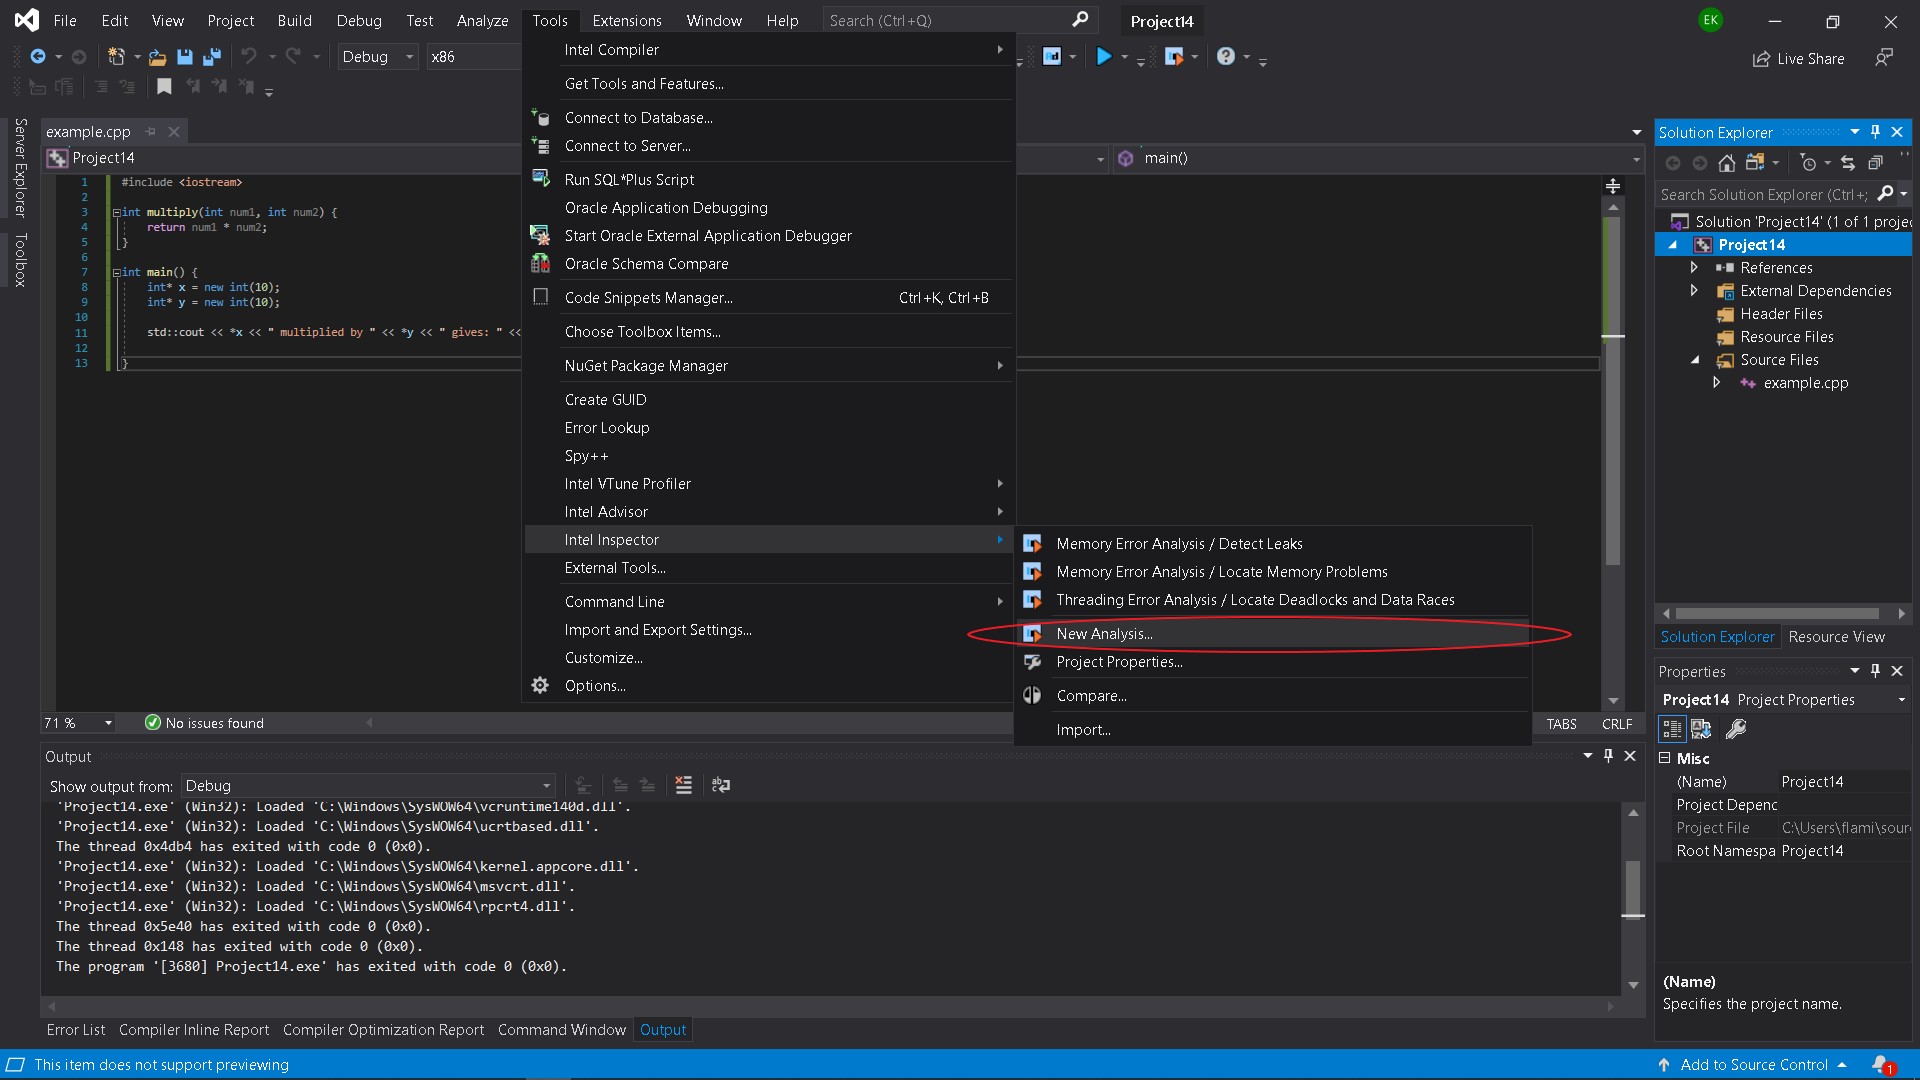
Once Intel Inspector is installed and you have a program you wish to analyze, navigate to:
Tools > Intel Inspector > New Analysis
Levels of Analyzation: Speed vs Thoroughness
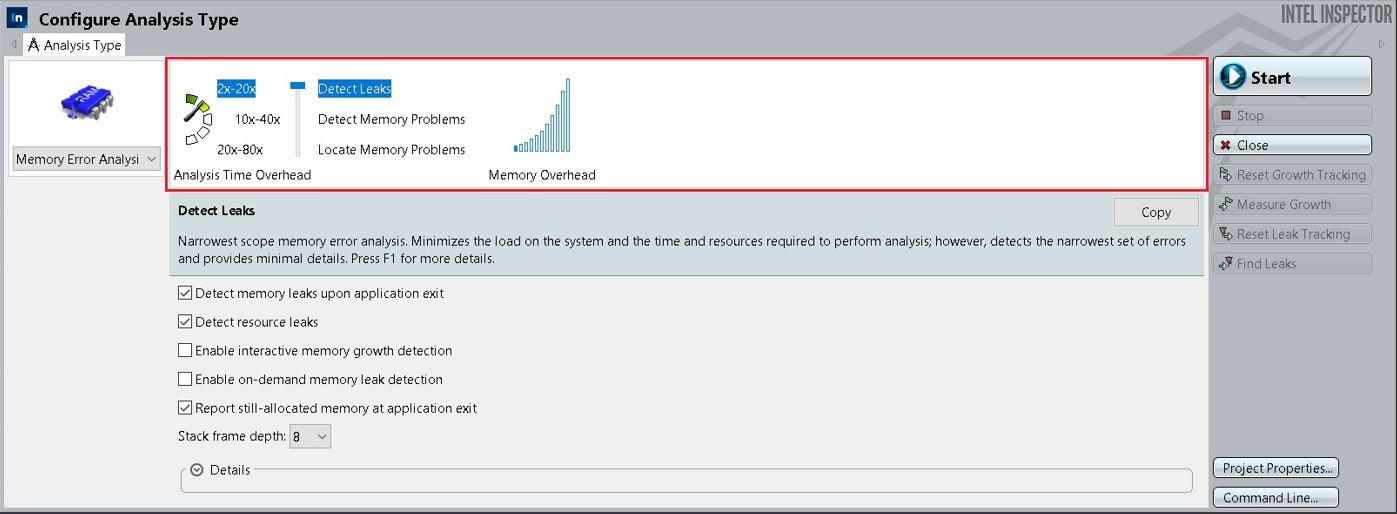
An Intel Inspector window will pop up, with different features. At the top, Intel Inspector lists 3 different types of analysis levels that can be selected.
Detect Leaks
The least thorough and intensive analysis. This setting reduces the stress on the system and cuts the resources and time to perform the analysis. As a result, this will produce a much faster analysis but will find a limited set of errors and provide fewer details
Detect Memory Problems
This setting indicates a medium-scope memory error analysis. It will increase time, resources, and load on the system when performing the analysis. This is a deeper level of analysis to find memory issues but is slightly slower.
Locate Memory Problems
This maximizes the scope of the memory analysis. Using this setting will also maximize the time, resources, and load on the system to perform the analysis. This will detect an extensive range of memory issues, display the context of the problem and the highest degree of information available.
Memory Analysis Options
Below are explanations of some important memory analysis options that a user may consider selecting:
Detect resource leaks – detect if a GDI object is not deleted, or a kernel object is not closed. Useful for Windows GUI Applications
Enable interactive memory growth – detect if a region of memory has been allocated, but not deallocated during a certain time of the program’s execution.
Enable on-demand memory leak detection – detect if a region of memory has been allocated, but not deallocated during a certain time of the program’s execution and is not reachable. (No pointer to the memory location still exists)
Remove Duplicates – When this setting is on, Intel Inspector will not display all incidents of detection in the Code Location
Stack frame depth – Sets the ...
Starting a Memory Analysis
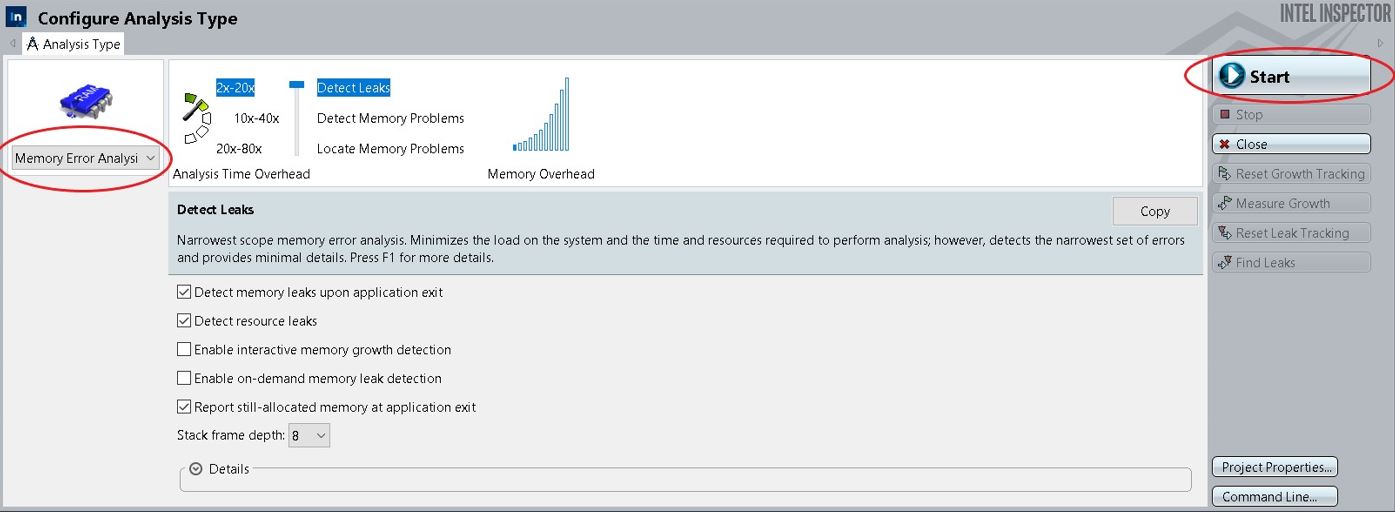
To start a memory analysis, the left-field must be set as “Memory Error Analysis”. After the desired options are checked, the user can click the “start” button located on the right-hand side to begin the analysis.


